
In the previous article you learned how to set up Plausible, a privacy-friendly and affordable analytics solution. In this article you'll learn how to use Plausible to collect the reading behavior of your visitors and display at the top of each of your articles how many people have read it.
Gathering information about your visitors is great, but having more insight into how many of them actually read your articles is even greater. To do this, we need to define the progress your visitor is making in a few stages. We'll later turn these stages into goals, which will provide you with detailed information about how well your articles are doing.
Tracking reading behavior
We will use a Medium.com inspired "read time". Medium.com calculates the read time based on the average reading speed of an adult (which is roughly 265 words per minute) and divides the total word count by this number. So if your article will contain 2650 words, it will take your visitors roughly 10 minutes to read. When measuring the progress we'll define a few steps to indicate the progress, each representing a percentage of the total reading time:
- opened (0%): not started reading yet
- peeked (10%): just scrolled quickly through the article
- quarter-read (25%): started reading, but stopped at a quarter
- half-read (50%): read half way
- three-quarter-read (75%): read between half way or the whole article for fast readers
- read (100%): read your article with great attention
It's also important to keep a few scenarios in mind.
Scenario 1 => the reader gets distracted and now your article is at the background
This is easy to mitigate, we can use an event listener to detect document visibility changes and stop the timer: document.addEventListener("visibilitychange".
Scenario 2 => the reader walks away from the computer
This is a bit harder to detect, but an option is to keep track of another indicator of 'reading', which is the scroll. So next to the time progress, we also track scroll progress, and only when both time and scroll reach a certain level do we update the read progress to the next state.
Click the button to see how you're doing, reading this page
To track the reading progress of your visitors, I've written a handy composable which you can view here: useReadProgress.ts
As reading progresses and the state changes, we update Plausible with custom events.
To do this I've written another composable, which you can view here: useReadProgressTracking.ts.
It converts the percentages from useReadProgress into the defined tracking goals and sends tracking events to Plausible.
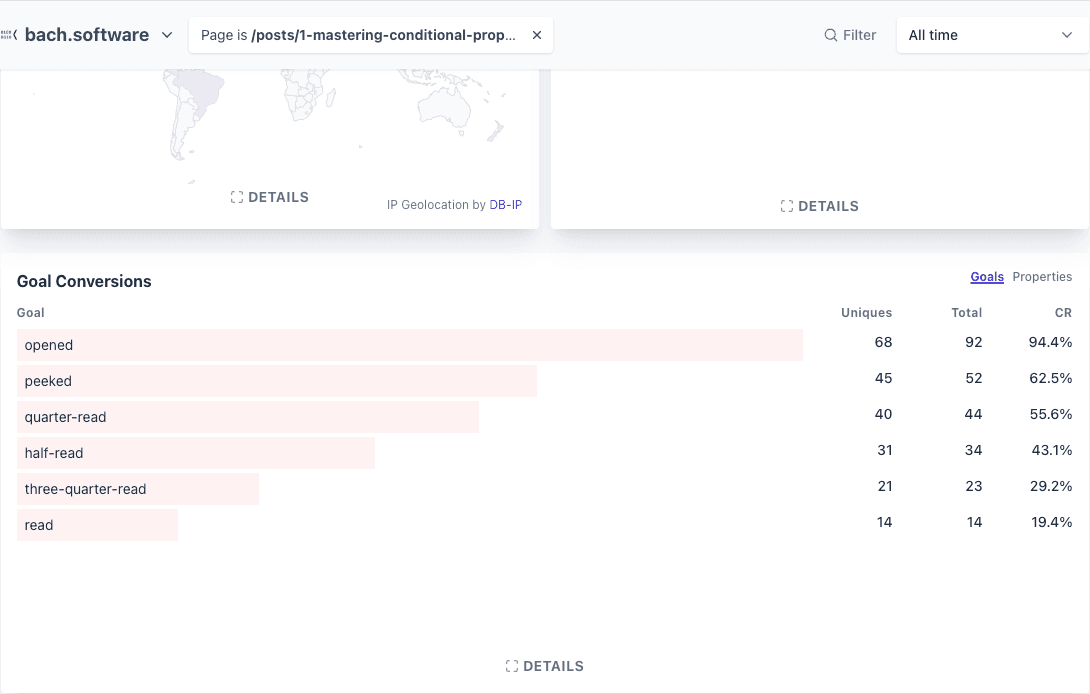
Create goals for each step in Plausible
When you define the above steps as goals in Plausible, you can see a nice funnel for each of your articles and how far your visitors get with them.
To set up goals in Plausible, go to Site Settings > Goals and add a goal for each of the steps (opened, peeked, etc).
Reading your page stats from Plausible, using an Azure Function
Plausible provides a Stats API that you can query to get for example the statistics of your created goals. See the following code example, which shows how to query the API.
public async Task<PageReads> GetPageReads(string url)
{
    using var scope = _logger.BeginScope(new Dictionary<string, object> { { "url", url } });

    var uri = new Uri(url);
    var domain = uri.Host;
    var relativeUrl = uri.PathAndQuery;

    var payload = new
    {
        site_id = domain,
        metrics = new[] { "visitors" }, // Get the unique number of Reading events
        date_range = "all",
        filters = new[]{
            new List<object> { "contains", "event:page", new[] { relativeUrl } },
            new List<object> { "is", "event:goal", new[] {"read", "three-quarter-read", "half-read", "quarter-read", "peeked", "opened"} },
        },
        dimensions = new[] { "event:goal" },
    };

    var jsonPayload = JsonSerializer.Serialize(payload);
    _logger.LogInformation("Payload: {jsonPayload}", jsonPayload);

    var response = await SendRequest(jsonPayload);
    var responseContent = await response.Content.ReadAsStringAsync();
    _logger.LogInformation("Response: {responseContent}", responseContent);

    var queryResult = JsonSerializer.Deserialize<QueryResult>(responseContent);
    if (queryResult == null)
    {
        throw new InvalidOperationException("Failed to deserialize the response content.");
    }

    var resultsDict = queryResult.Results.ToDictionary(x => x.Dimensions.First(), x => x.Metrics.First());

    return new PageReads
    {
        Read = resultsDict.GetValueOrDefault("read"),
        ThreeQuarterRead = resultsDict.GetValueOrDefault("three-quarter-read"),
        HalfRead = resultsDict.GetValueOrDefault("half-read"),
        QuarterRead = resultsDict.GetValueOrDefault("quarter-read"),
        Peeked = resultsDict.GetValueOrDefault("peeked"),
        Opened = resultsDict.GetValueOrDefault("opened"),
    };
}
{
  "site_id": "{{site_id}}",
  "metrics": ["visitors"],
  "date_range": "all",
  "filters": [
    ["contains", "event:page", ["{{relative_url}}"]],
    [
      "is",
      "event:goal",
      [
        "read",
        "three-quarter-read",
        "half-read",
        "quarter-read",
        "peeked",
        "opened"
      ]
    ]
  ],
  "dimensions": ["event:goal"]
}
{
  "results": [
    { "metrics": [68], "dimensions": ["opened"] },
    { "metrics": [45], "dimensions": ["peeked"] },
    { "metrics": [40], "dimensions": ["quarter-read"] },
    { "metrics": [31], "dimensions": ["half-read"] },
    { "metrics": [21], "dimensions": ["three-quarter-read"] },
    { "metrics": [14], "dimensions": ["read"] }
  ],
  "meta": {},
  "query": {
    "site_id": "{{site_id}}",
    "metrics": ["visitors"],
    "date_range": ["2025-01-20T00:00:00+01:00", "2025-08-02T23:59:59+02:00"],
    "filters": [
      ["contains", "event:page", ["{{relative_url}}"]],
      [
        "is",
        "event:goal",
        [
          "read",
          "three-quarter-read",
          "half-read",
          "quarter-read",
          "peeked",
          "opened"
        ]
      ]
    ],
    "dimensions": ["event:goal"],
    "order_by": [["visitors", "desc"]],
    "include": {},
    "pagination": { "offset": 0, "limit": 10000 }
  }
}
See the full implementation here PlausibleService.cs and the whole project here Bach.Software.API
Conclusion
Understanding how deeply your audience engages with your content is far more meaningful than simply counting pageviews. With just a few lines of code and the power of Plausible, you can now accurately track whether your readers are skimming or truly diving in. By combining scroll behavior and reading time, you can fine-tune your editorial strategy and identify what resonates most. And because it's cookie-less, it aligns with modern privacy standards without sacrificing insight.
Whether you're a solo developer, a blogger, or managing a larger content platform, this approach gives you deep insights without the weight of invasive tracking. Try it out on your next post, you might be surprised by what your readers are really doing.